
Poisson calculator: expected goals into match probabilities
Football goals follow a Poisson distribution closely enough to be useful. Give the model an expected goals figure for each side and it returns fair prices for the match result and the main goals markets.
Why a Poisson distribution fits football
The Poisson distribution describes how often a rare event happens in a fixed period when each occurrence is roughly independent. Goals fit that description reasonably well: they are infrequent, they can happen at any point, and one goal does not straightforwardly cause another.
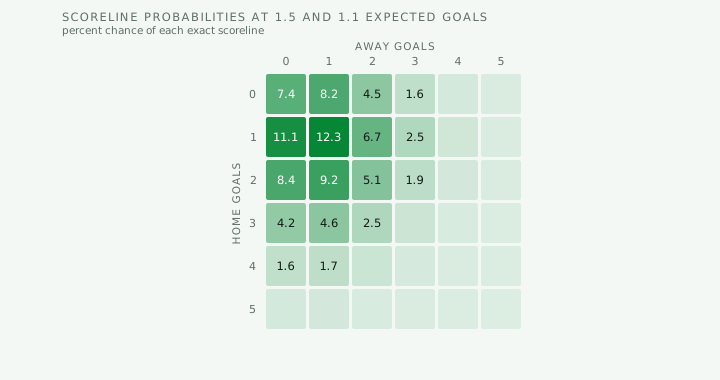
Give the model an average — say 1.5 goals for the home side — and it produces the full distribution: how often that side scores none, one, two, three and so on. Doing the same for the away side and combining the two gives a probability for every scoreline, which can then be summed into any market you like.
The output is a set of fair prices with no margin in them. Compare those with the bookmaker prices and you have the beginnings of a value assessment — subject entirely to whether your expected goals inputs are any good.
Where the model is wrong, and it matters
Poisson assumes goals are independent, and they are not. Teams that concede first change their approach; a red card alters everything; a side two goals up often stops attacking. These effects mean real football produces slightly more draws and slightly more high-scoring games than a pure Poisson model predicts.
The best-known consequence is that basic Poisson underprices the draw, typically by a few percent. More sophisticated approaches — the Dixon-Coles adjustment is the standard reference — apply a correction to low-scoring scorelines to compensate. This calculator deliberately implements plain Poisson rather than a corrected version, so the output is transparent and you can see exactly what it is doing.
Treat it as a structured way of turning a goals estimate into prices, not as a prediction engine. Its usefulness depends almost entirely on the quality of the expected goals figures you feed it, and those are the hard part.
Getting sensible expected goals inputs
Published xG figures for recent matches are a reasonable starting point, adjusted for the opposition and for home advantage. Premier League home sides average roughly 1.5 goals and away sides roughly 1.2, so those numbers are a sane default to work from.
A common approach is to take a team's attacking strength relative to the league average, multiply by the opponent's defensive weakness, and scale by the league's average home or away goals. That is more involved than this calculator attempts, but the arithmetic is straightforward and it gives inputs with some grounding rather than a guess.
It is worth testing the model against prices you already believe are efficient before trusting it against ones you do not. Feed in expected goals for a heavily traded match, compare the model output with the no-vig market price, and see how far apart they land. If the model disagrees with an efficient market by ten points, the model is wrong, and finding that out on a match where the answer is known is much cheaper than finding it out on one where it is not.
The correct-score output is the part to treat most carefully. Individual scorelines carry small probabilities and large relative errors, so a model that is broadly right about the match result can still be badly wrong about whether a game finishes 2-1 or 3-1. Aggregated markets such as over/under and both teams to score are far more robust, because summing many scorelines cancels much of the individual error.
Poisson football model questions
What is a Poisson distribution in football betting?
A statistical distribution that models how often a rare, independent event occurs in a fixed period. Applied to football, it converts an expected goals figure into the probability of each possible scoreline.
How accurate is a Poisson model for football?
It captures the broad shape of scoring well but underestimates draws and very high-scoring games, because goals are not truly independent. Adjustments such as Dixon-Coles correct for this; plain Poisson, as used here, does not.
Where do I get expected goals figures?
Published xG data for recent matches is the usual source, adjusted for opposition strength and home advantage. As a baseline, Premier League home sides average around 1.5 goals and away sides around 1.2.
Why does the model underprice the draw?
Because it assumes goals are independent when in practice team behaviour changes with the score. Sides protect a lead or settle for a point, which produces more draws than pure independence implies.
Can I use this to find value bets?
It gives you a fair price to compare against the bookmaker price, which is the mechanism behind value betting. Whether the comparison is meaningful depends entirely on whether your expected goals inputs are better than the market's.