
Bankroll simulator: test a staking plan across 3,000 runs
A real edge does not stop losing runs from happening. This simulates thousands of sequences of bets at your chosen edge and staking plan, and shows the whole distribution of outcomes rather than a single average.
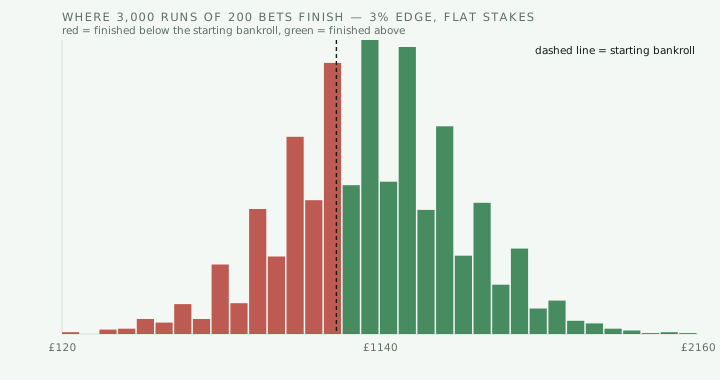
What the simulation does
Each run plays out the number of bets you specify at the price and edge you set, staking according to the plan you choose. The simulator does that three thousand times and collects the final bankroll from every run.
The output is a distribution rather than a single number. The median tells you the middle outcome; the fifth and ninety-fifth percentiles show what a bad and a good run look like; the risk of ruin counts how often the bankroll was effectively wiped out. Those spread figures are the point — an average on its own conceals everything that matters about a staking plan.
The edge is expressed as a percentage advantage over the fair price. A 3% edge at 2.00 means you win 51.5% of the time rather than the 50% the price implies. That is a genuine and quite substantial edge by real-world standards.
What the results usually show
The first thing most people notice is how often a genuine edge still produces a losing run. With a 3% edge over 200 bets, a meaningful share of runs finish down. That is not a flaw in the edge; it is what variance looks like at realistic sample sizes, and it is the reason results over a few dozen bets tell you almost nothing.
The second is what martingale does. Doubling after every loss produces a high proportion of small winning runs and a small proportion of catastrophic ones, and the catastrophic ones more than cancel the rest. Run it alongside flat staking at the same edge and the difference in risk of ruin is stark. No staking plan converts a negative edge into a positive one, and martingale converts a positive one into a gamble on not hitting a losing streak.
The third is that percentage and fractional Kelly staking reduce the risk of ruin considerably compared with flat staking, because the stake shrinks as the bankroll does. The cost is a lower ceiling on the best runs. That trade is the whole substance of staking plan design.
What the simulator cannot tell you
It assumes your edge is real, constant and known. In practice an edge is estimated, varies between bets, and often disappears once accounts get restricted. Nothing in a simulation captures a bookmaker cutting your maximum stake to £4.
It also assumes every bet is independent and settled at the same price, which is a simplification. Treat the output as a way of understanding the shape of variance and the behaviour of staking plans, not as a forecast of your own results.
Bankroll simulator questions
What is risk of ruin in betting?
The probability that a bankroll is lost entirely, or reduced to the point of being unusable, before the edge has time to show. It depends on the size of the edge, the stake as a proportion of bankroll, and the number of bets.
How many bets does it take for an edge to show?
Far more than most people expect. With a small edge, several hundred bets can easily finish in the red purely through variance. The simulator makes that concrete by showing how many of three thousand runs finish below the starting bankroll.
Does the martingale system work?
No. It produces frequent small wins and rare catastrophic losses that outweigh them. The simulator shows this directly — compare the risk of ruin for martingale against flat staking at the same edge.
What is a realistic betting edge?
A sustained edge of 2% to 5% over the closing line is a strong result for a serious bettor. Claims of much more than that over a long sample are usually measurement error, a short sample, or a market that has since been corrected.
Which staking plan is best?
It depends on how much volatility you can tolerate. Fractional Kelly and percentage staking reduce the risk of ruin by shrinking stakes as the bankroll falls; flat staking is simpler and easier to follow. Both beat any progression system that increases stakes after losses.